William Thomson Kelvin, a 19th-century physicist, and mathematician said a phrase that I love:
“What is not defined cannot be measured. What is not measured cannot be improved. What is not improved always degrades.”
Lord Kelvin worked in the world of thermodynamics, and if you are familiar with his name, it is because he is indeed the creator of the Kelvin temperature scale.
In his book “Popular lectures and addresses” he wrote:
“In physical science, an essential first step to learn any subject is to find principles of numerical calculation and practical methods of measuring any quality connected with it. I often say that when you can measure that of which you are speaking and express it in numbers, you may know something about it. But when you cannot measure or say it with numbers, your knowledge is precarious and unsatisfactory: it may be the beginning of knowledge, but you have hardly advanced your ideas in the scientific stage, whatever the subject is ”.
However, it was Peter Drucker, considered the father of management, who made it famous. Drucker highlighted the importance of measuring to see the evolution and draw conclusions, always with a view to continuous improvement.
From this phrase came this other one that goes perfectly:

I am very visual. I use graphic facilitation to take notes, read, explain something to my colleagues or provide trainings. For me, visualization is the key, and it is also the key to the Kanban System.
What is the Kanban system?
Kanban is a flow management system that grew out of Japan’s Toyota Production System (TPS) in the 1940s. It became popular in the 1960s after “Kanban: Successful Evolutionary Change for Your Technology Business” by David J. Anderson, popularly known as “The Kanban Blue Book“.
It states that the Kanban method is based on 5 practices:
- Visualizing
- Limiting WIP or Work In Progress (WIP)
- Managing the flow
- Making policies explicit
- Providing feedback loops
The first key is to visualize, to make information visible to make strategic, tactical or operational decisions. And how is that done in Kanban?
To begin with
“Kanban” comes from the Japanese words kan, visual, and ban, card. In other words, cards display information. These cards contain the minimum necessary information to make the right decisions. To add a twist, the board on which these small cards are placed is also called a kanban!
Kanban board
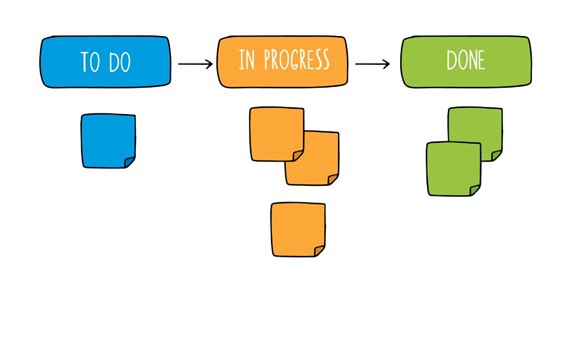
It is made of several columns, usually To do, In progress and Done; in other words, To do, Doing and Done, the minimum version of a Kanban board:

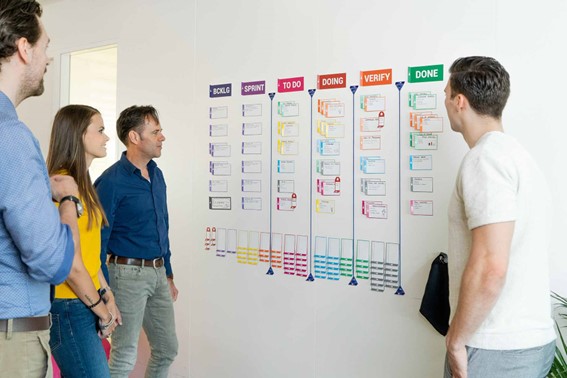
Each column represents a state that tasks go through in their workflow, from start to completion. There may be variations; there may be more columns, but, in any case, it should help us see where each task is at any given moment.
The function of the Kanban board is to radiate information. The more complex the workflow, the more we risk complicating our board. To prevent this, always start from the simplest and adapt the board little by little.
Visual cards
These are visual representations of the tasks that move from column to column on the board.

These are visual representations of the tasks that move from column to column on the board.
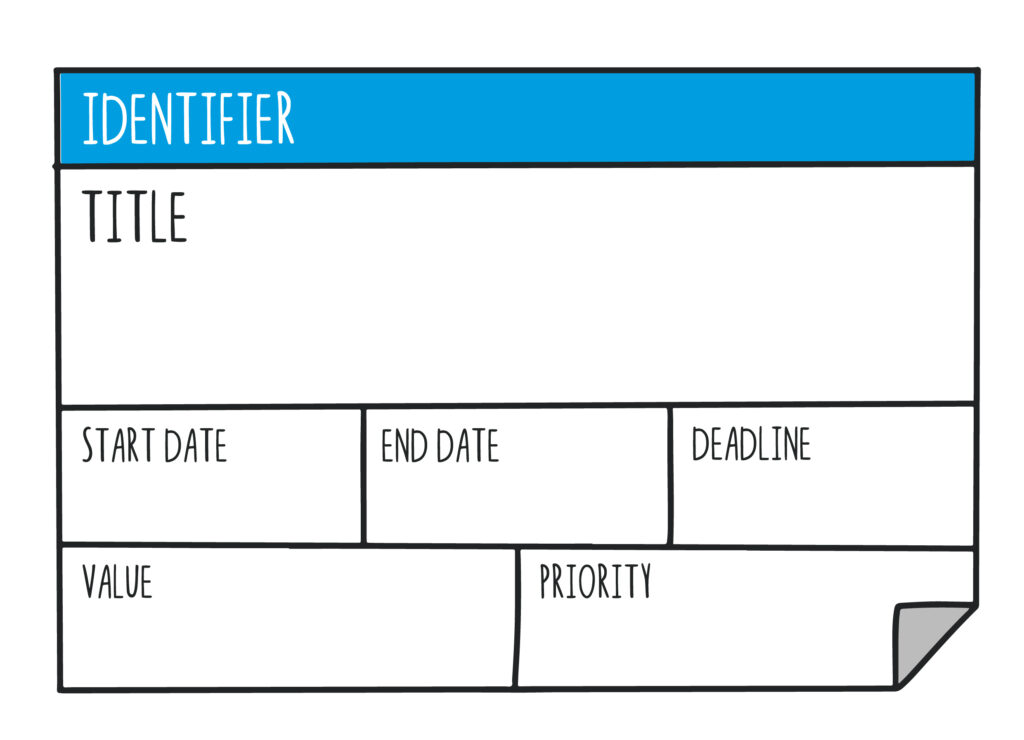
As with the boards, the cards can also be very different. One team may need to show data that another team may not. The important thing is that they offer relevant information for each case. As a general rule, they usually contain the following fields:
- Identifier: to avoid duplication and misunderstandings between tasks.
- Title: descriptive if possible so that everyone knows exactly what it consists of
- Start date: the first day on which work on the task was started
- End date: the day on which the task is completed
- Deadline: the deadline by which the task must be completed
- Value: the benefit of performing this task
- Priority: the order in which it should be addressed with respect to other tasks on the board.
With this information on the Kanban board, we will be able to know:
- Which task should the team get to work on first (high priority and/or close deadline)
- How to plan ourselves according to the deadlines we have
- How many days have been spent on a task (difference between end date and start date) and thus know the team’s delivery time.
By having all the information visible, managers, teams or even individuals can make the necessary decisions to advance in their daily work.
Tools that can help
When this way of working emerged, both boards and cards were physical. Kanban boards were located on the walls of offices and/or production rooms, and the cards were paper cards glued to the boards.

Today we can work remotely, from anywhere and using any device. Online tools simulate these physical boards and their cards. Some examples can be Trello and Jira (from Atlassian), or we can use Miro.


In any case, whether physical or digital, the purpose is always the same: to radiate information and help those who consume it to make the best decisions.