Value Stream Management: Flow Framework metrics
- Home
- Knowledge Center
- Value Stream Management: Flow Framework metrics
Value Stream Management by Gabriel Cassarini and co-author Alonso Álvarez
In this series’s previous article, we presented the taxonomy proposed by Flow Framework to classify the items that travel through a software development value stream. We also analyzed how the distribution of these items directly influences the sustainability of the team’s work and the quality of the product delivered to customers.
Today we will discuss the metrics proposed by the Framework to manage and visualize the activity in the value streams.
The limitations of local metrics
Agile and DevOps principles have had a substantial positive impact on the way technical teams work. But there is still a vast gap between these teams-who have learned how to produce software effectively-and the way companies approach software projects. Business stakeholders have not adopted agile principles. We saw this earlier with Nokia.
Technical teams have been mining metrics to guide their continuous improvement processes for a very long time now. There are hundreds of metrics available to measure operational efficiency and activities. For example, with DevOps, you can measure the number of deployments per day, monitor the availability of settings, the success rate of tests, and so on. In development teams, we measure progress during sprints by inspecting dashboards, number of story points, number of bugs fixed, level of cyclomatic complexity, number of lines of code, percentage of green unit tests…
All those metrics are handy, but they are local. What’s more, the metrics are operational-they only refer to activities and processes. To close the gap between IT and business, we need a new, broader framework that can connect the two worlds; we need to look at the entire value stream and see the impact of the teams’ activities on the business. In this way, companies can make better decisions with data. For example, suppose there is a rush to release a new version at the cost of sacrificing quality. In that case, this impact should be visible in the quality metrics-we saw earlier that technical debt is a leading indicator of the team’s agility and, consequently, of the company’s agility to continue innovating.
Flow Framework metrics
Flow Framework proposes to use 4 metrics to achieve this. They are easy to understand and represent visually, and they help to see trends, blockages, atypical situations and make decisions quickly.
The goal is to make the work visible in real time-like the instruments in the cockpit of an aircraft that inform pilots of all parameters during the flight.

Flow Framework uses these metrics: Flow Velocity, Flow Load, Flow Time and Flow Efficiency. We analyze them in detail below.
1. Flow Load
It is the number of items in progress at any given time. It represents the active and partially completed workload-the Kanban WIP. If the load is too high, the team is not very practical because much work in progress is possibly blocked or on hold. If the shipment is too low, we are underutilizing the available capacity.
This metric helps to see if the system is overloaded and work is not flowing. It is what we call a leading indicator because it anticipates the result of other metrics: Flow Time, Flow Velocity and Flow Efficiency. By visualizing the system load, business areas can see the negative impact of overloading the team 100% in implementing new features – overutilization of resources is counterproductive in software production.
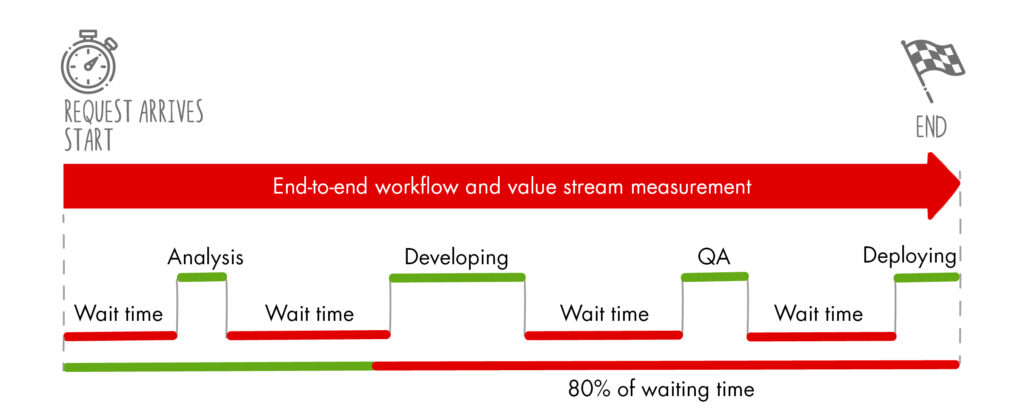
2. Flow Time
It is the total time that elapses from when an item enters the value stream until it is marked as completed. All-time is accounted for, including the waits and blockages. As we are talking about total time, it is interesting to note that items do not always follow linear paths within the stream. For example, if an issue needs to be solved in 24 h, it should be possible to accelerate its journey through the value stream stages to reach the team’s backlog quickly. In Kanban, these rules governing the flow are called policies, and we want them to be explicit and visible to all stakeholders of the value stream. Flow Time is an excellent parameter to consider when reviewing policies.
3. Flow Velocity
This metric represents the speed at which items flow through the value chain. More specifically, it is the number of Flow Items completed in a specific time. For example: “15 features completed in the last sprint”. We can use it as a measure of the amount of value delivered to customers over time.
Each value stream has a configuration and characteristics that are unique. And so, it is essential to keep in mind that the velocity metric is only appropriate to analyze productivity and trends within each value stream rather than for comparing several different streams. However, if the contexts are similar, it is relevant to compare. For example, it makes sense to consider the speed of a piece of equipment as a reference if we have to implement a regulatory framework such as GDPR across several products.
4. Flow Efficiency
It is a value between 0 and 100%, which measures the team’s time working on an item versus the total time that the item has been in the workflow. It is the ratio of active time to total time. Efficiency tells us how smoothly the teams work. If an item’s efficiency is too low, it means that it spends too much time waiting-for example, waiting for approval from an unavailable expert. If it is too high, there may be blockages and bottlenecks that are not being detected correctly. In general, the efficiency of a productive team is no more than 20%.
The importance of metrics
We have seen that it is crucial to have a decision-making framework that gives visibility to the entire value delivery flow-precisely what Nokia did not have. Software development is increasingly vital to organizations, and it is essential to know when it is most appropriate to address, for example, a drastic overhaul of platforms and infrastructure without jeopardizing the viability-or decline of the business.
Flow Framework proposes a metrics-based framework to have traceability along the entire value delivery chain and through all phases: solution ideation, development, implementation and operations from beginning to end.
The following image shows graphics of Flow Framework metrics. Each color represents a different type of item.
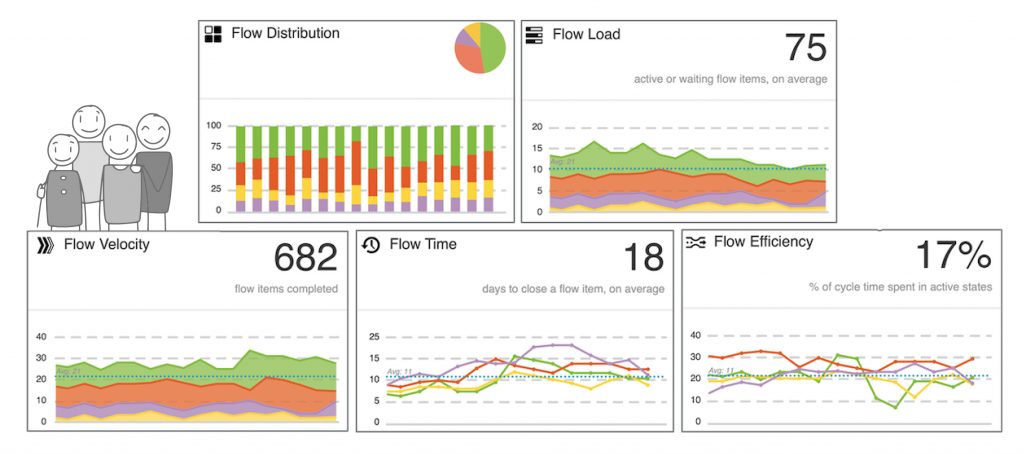
There is still a need to analyze how to map these metrics with business results. Is it possible to do so? What steps should be taken?
We will talk about this in the following article.