
There are many reasons to document a work process, although at their heart, all of the reasons boil down to one thing: communication.
In this article, we will take a look at some of the reasons why it’s necessary to document processes, even in an agile world. We’ll examine a few of the challenges involved in creating process documents, and explain why process maps are often the best technique. We’ll also look at the four minimum requirements for creating process maps and evaluate several alternative mapping styles.
Important note: the work that is required before you can create a process map is not described in this blog post. To learn more about process analysis, please refer to our Business Process Analysis course.
Reasons to Document Processes
The specific reason for documenting a process may change, but typically you need process documentation because you want to:
- transfer knowledge to new employees
- ensure compliance with organizational policy or government regulations
- control and mitigate risk exposure
- optimize workflow
- ensure repeatability and consistency of service delivery
Regardless of the reason you need to document a process, you will need to define tasks, roles, time constraints, tools, supporting materials, and other key process parameters.
Documenting Processes Isn’t Easy
Creating effective process documentation is hard work. The challenge is to create a style of documentation that works for everyone, conveys the right information quickly, doesn’t require significant training, and is easy and fast to change. The latter is especially true for agile organizations – there’s no point in creating documents that can’t keep up with you.
Fortunately, the days of filling three-ring binders with text as the means to document processes are over! The best solution for creating easy-to-read documents that define how work should be done is usually to build process maps. After all, when you’re trying to communicate information about a process, a picture is definitely worth a thousand words. In addition to being a pretty picture, however, a well-crafted process map can also contain all of the data your audience needs, plus it can include hyperlinks to other relevant content.
Minimum Requirements for Effective Process Maps
Once you’ve decided to use process maps, your next decision is which style of process map to use: Flowcharts? Swimlanes? Business Process Model and Notation (BPMN)? Another alternative?
Creating effective process maps requires four things:
- a set of symbols;
- a technique to ensure that everyone uses and understands the symbols in the same way;
- data about each process step;
- a drawing tool to link graphical elements into a readable map.
In addition, the software you use should make it easy to add hyperlinks to a process map because not every detail about every process belongs in a map. By creating links from a map to other documents and resources, the map becomes the central repository for all process knowledge.
Symbols
The purpose of each symbol used in a process map should be clear at a glance and each symbol should be visually distinctive. In addition, there should be as few symbols as possible so the reader of the map can realistically remember them all.
Unfortunately, most process mapping techniques involve a profusion of symbols. The flowchart stencil included with Microsoft Visio, for example, contains more than a dozen shapes. BPMN is even worse – the degree of specificity you can incorporate into a BPMN diagram comes at the cost of a symbol set that contains dozens of shapes and variations.
A large number of shapes can be a problem for someone creating a map, but imagine the plight of the map user. If you’re a business person who doesn’t look at process maps that often, how are you to remember the differences among the flowchart shapes on the left below or the BPMN gateway shapes on the right?
 |
 |
While it’s true that most process maps will only use a subset of all available shapes, if you use a mapping style that only offers a small number of possible shapes, it should be easier for both map creators and map users.
Our Unofficial Guide to Process Flow Chart Symbols takes a deeper dive into the proper use of symbols and also includes a Process Flow Chart Symbols Cheatsheet.
Technique
A set of shapes, by itself, is not sufficient for creating a map. There must be a technique that guides the use of the symbols in a map.
The mapping techniques associated with some Business Process Management (BPM) systems require volumes of documentation and extensive training to enable practitioners to create “correct” process maps. While the resulting maps can contain everything you need to know about a process, very sophisticated mapping techniques have a significant downside: users may require specialized training simply to read the maps.
At the other end of the spectrum are flowcharts for which there are surprisingly few rules. Even if an organization agrees on a flowcharting style, flowcharts often fall short because they don’t answer key questions, e.g., Where do I find additional information or instructions? Who assists if the task owner needs help? How often does this step occur? What tools are needed to complete this task?
Somewhere in the middle is BPMN. The BPMN standard controls how the shapes should be used and it’s possible to document a process at a very significant level of detail. However, BPMN diagrams tend to be sufficiently complex that it’s difficult for business users to read and interpret them easily.
These few paragraphs are not intended to be a comprehensive review of all process mapping techniques; an online search will turn up dozens of books and articles on the subject. If your organization has not adopted a specific technique for mapping processes, it will be worth spending time up front to decide which style of map best suits your audience and helps you achieve your mapping goals.
Data
Being able to store data in process shapes, and preferably to view and visualize the data, is important for creating comprehensive process maps. In addition to obvious things like a description of each task and who does the work, you might want to track risks and controls, time, dates, or key performance indicators for each step in a process.
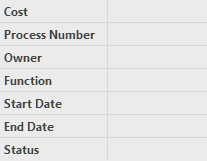
Although few people are aware of it, many of the shapes used in Microsoft Visio include predefined data fields. For example, the Visio flowchart and swimlane diagram shapes contain seven data fields that allow you to record details about each step in a process (refer to figure on the right). You can also add your own data fields to any Visio shape.
BPMN shapes in Visio also contain predefined data fields. Most fields are specific to BPMN but there are a few general-purpose data fields as well.
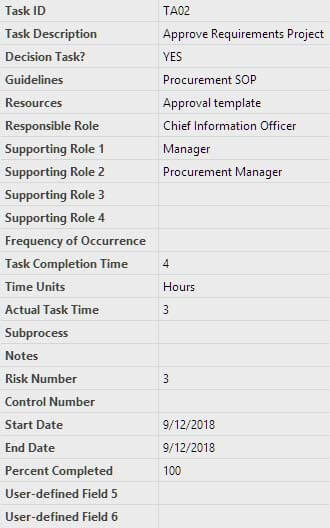
You will also find data fields in other Visio shapes and in the shapes used in other diagraming tools (the set of fields shown on the right are included with TaskMap®, which is described in the next section). As you decide what content you want in your process maps, consider the predefined fields in the shape sets you encounter. Each set of fields will help you refine the list of data attributes that will provide the most value for the readers of your maps.
Drawing Tool
You can create a process diagram with a pencil and paper. You can stick Post-It® Notes on a wall. You can draw on a whiteboard. In this electronic age, however, at some point you’re going to want an electronic version of your process map.
Available tools range from the custom drawing tools included with high-end Business Process Management (BPM) systems to general purpose business diagramming tools such as Visio, SmartDraw, and draw.io.
Among those, Visio is arguably the most widely used. (It’s also true that creating flowcharts is the most common reason people use Visio: Microsoft estimates that one-third of all Visio diagrams are created from one of the flowchart templates.)
There are also specialized mapping products like TaskMap® from Harvard Computing Group. TaskMap incorporates the ideas described above so that users can build highly visual, content-rich maps. In particular, TaskMaps are easy to create and easy to read because:
- The TaskMap shape library contains exactly six shapes.
- The TaskMap methodology is designed into the TaskMap shapes.
- Key data attributes are predefined in the TaskMap shapes (the Task shape also provides six user-defined fields).
- TaskMap was implemented as a Visio add-in so its unique features leverage the underlying power of Visio.
Other questions to consider when evaluating process mapping software: Can a map be linked to an external data source so you aren’t required to retype data into the map? Once you’ve created the map, can you run reports on the data in the map? Can you create a Microsoft Project plan directly from the map? Can you easily create a PowerPoint presentation when you want to show the map to an audience? Can you publish the map to the web so it can be viewed in any browser on any device?
If your organization has not adopted a specific tool for process mapping, you will want to spend time investigating available software to find a tool that incorporates the best set of shapes, uses the right methodology, and includes the right data attributes.
Process Map Examples
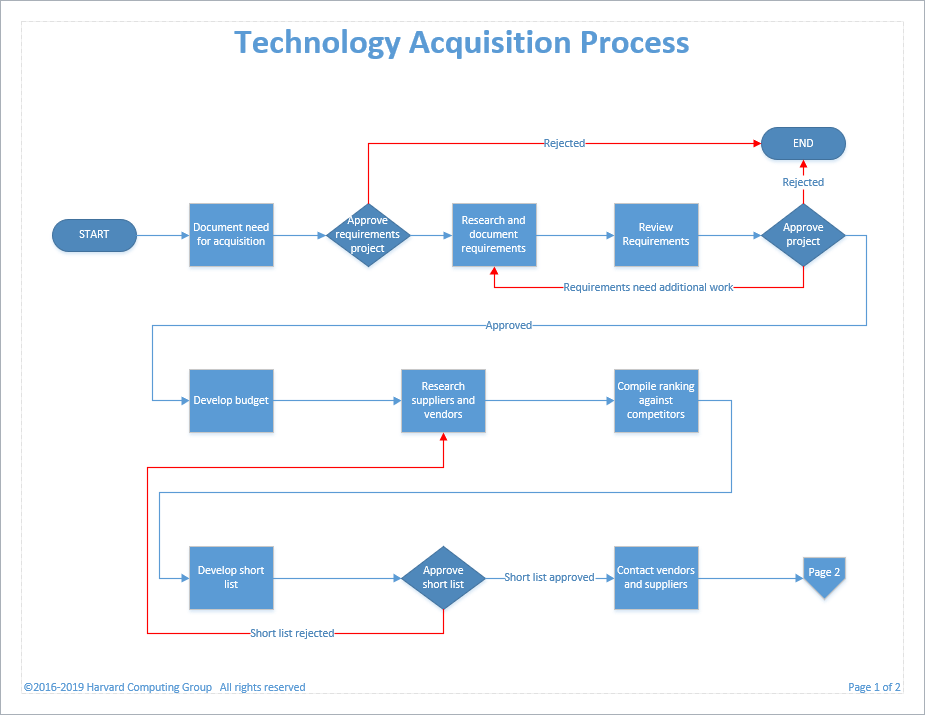
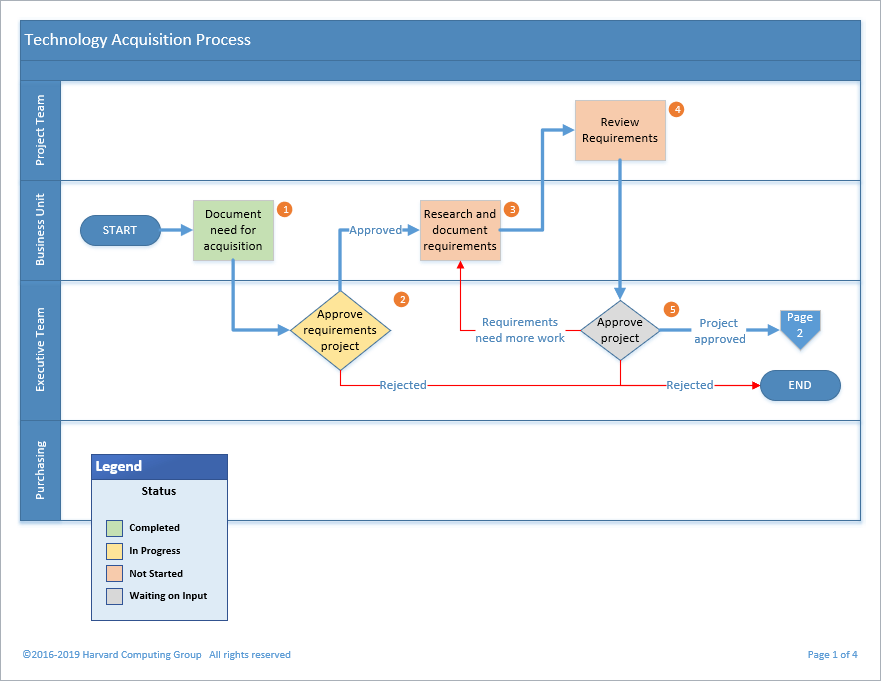
Click any of the four thumbnail images below to see the first page of a sample process map. All four examples use the same process – it happens to be the process by which a company identifies a technology solution for a business requirement – so you can compare the same process mapped in different styles.
Example 1 Although none of the data is visible in this basic flowchart, remember that Visio flowchart shapes do include the seven data fields shown above.
Example 2 In this swimlane diagram, data visualizations have been applied to display the step number and to highlight the status of each step. (A wide variety of visualizations can be applied to any type of Visio diagram.)
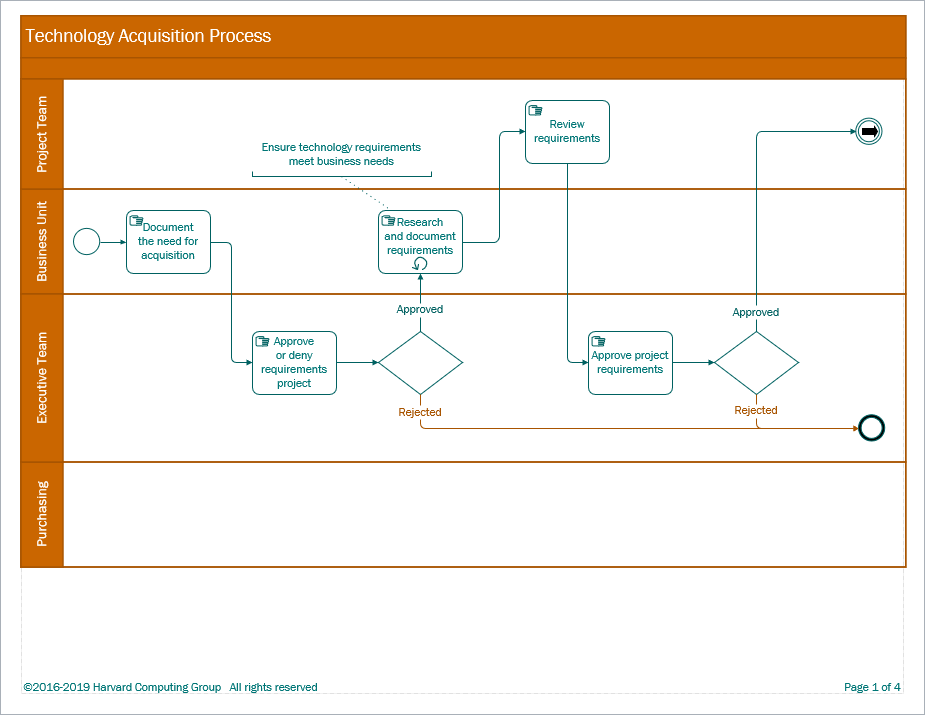
Example 3 BPMN diagrams can use pools and lanes, as this one does, but lanes are not required in BPMN.
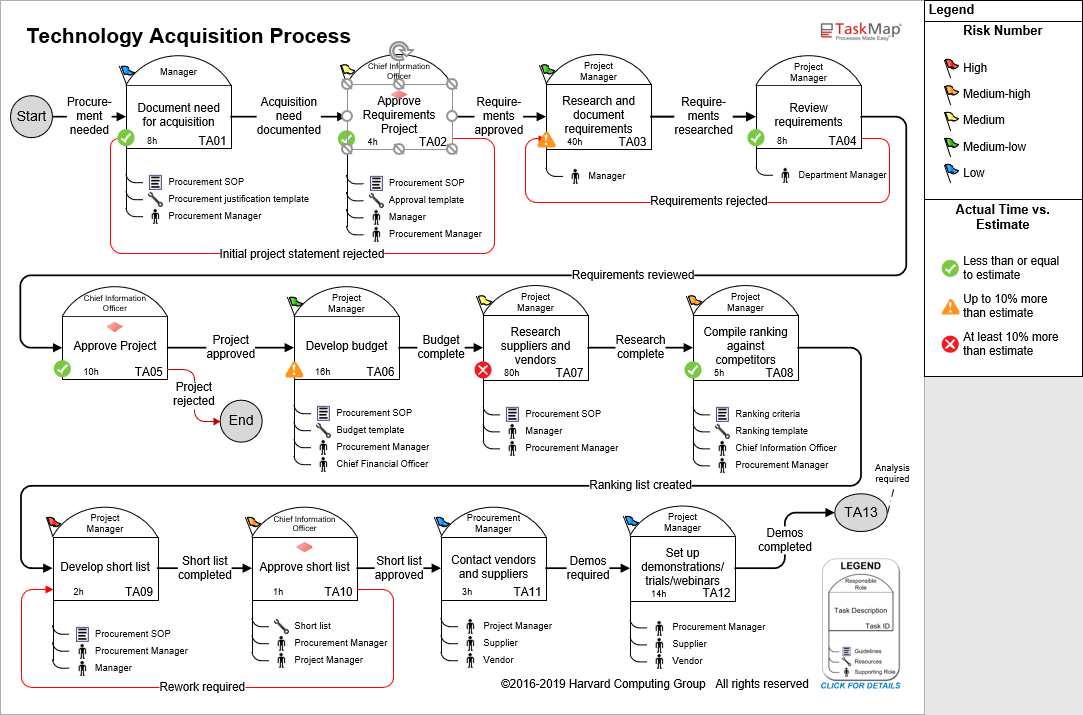
Example 4 In this TaskMap, most key data fields are displayed in a manner that is unique to TaskMap. This particular map also visualizes risks and actual vs. estimated completion times (many other visualizations are possible).
 |
 |
 |
 |
Conclusion
There isn’t one, correct way to document business processes. However, our experience at Harvard Computing Group suggests that a map is almost always the best technique. This is especially true when a map includes essential process data, visualizations of whatever data requires focus at a given moment, and hyperlinks to the external resources that are key to completing the work of the process.
You can use flowcharts, swimlane diagrams, BPMN, TaskMap, or another mapping style, but whatever you choose, be sure that your maps contain sufficient data and present information in a way that helps everyone involved with a process to communicate more effectively.
Additional information:
Good luck!
– Scott
More on Process Mapping
Unofficial Guide to Process Flow Chart Symbols
Business Process Analysis
Potential Areas for Process Improvement Quick Tips
Business Process Definition Interview Checklist
